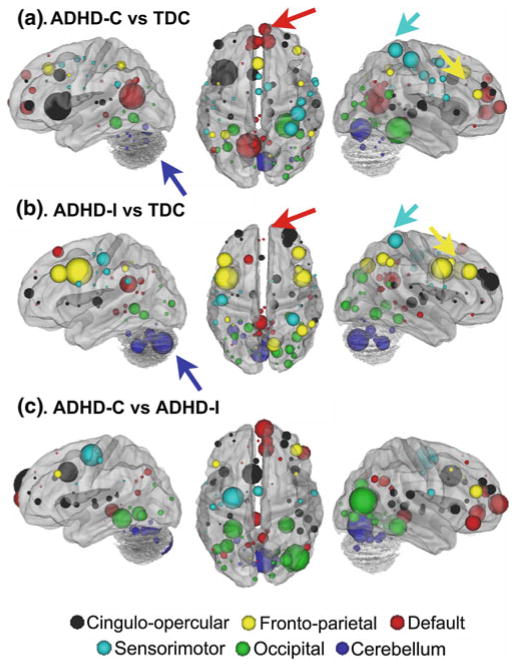
Fig. 1.
Using multivariate pattern analysis to compare the two most common subtypes of ADHD (ADHD-Inattentive and ADHD-Combined), this report showed relatively strong classification for single subjects (Fair et al. 2012b). Up to 77.0 % accuracy was attained for ADHD-C compared to typically developing controls (TDC), and up to 80.8 % accuracy for ADHD-I compared to TDC. Note that the features, or connections, that contributed most strongly to these predictions showed distributed patterns of atypical connectivity relative to TDC, measured by “differential” node strength (nodes with many connections that differentiated groups). Node strength for ADHD-C versus TDC shows strong differentiation in regions (a) somewhat different from those found in ADHD-I versus TDC (b). c Comparisons between the subtypes show similar trends. Node colors: red, default; blue, cerebellum; yellow, fronto-parietal; black, cingulo-opercular; green, occipital; cyan, sensorimotor

