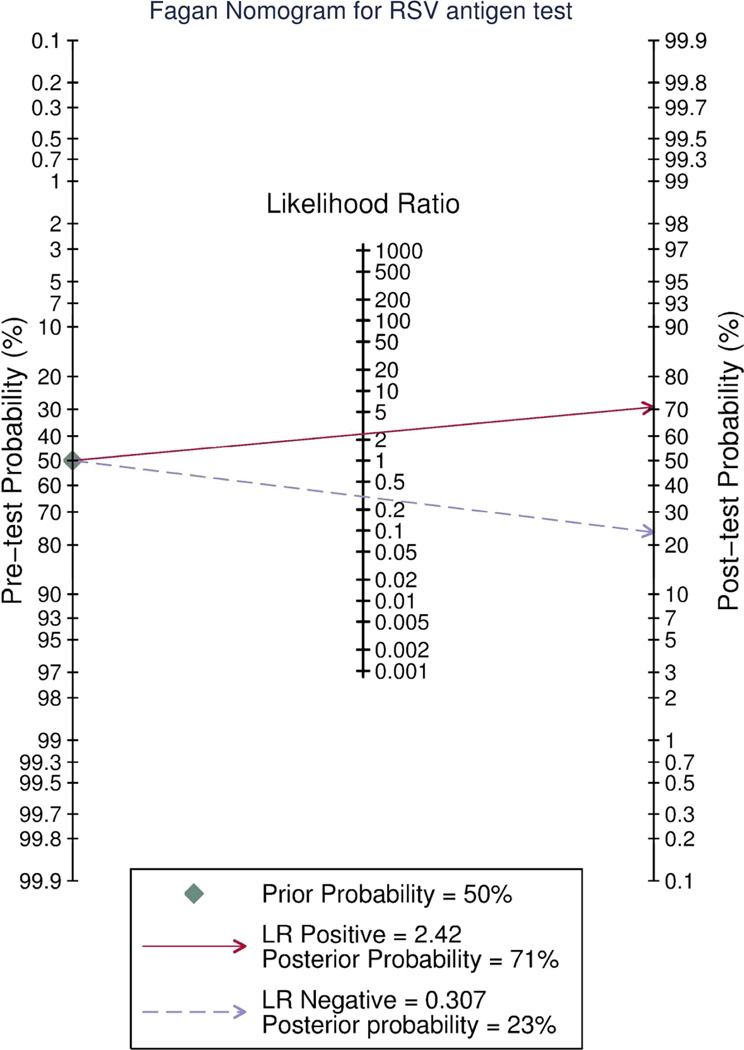
Figure 3.
The Fagan nomogram allows the user obtain a Bayesian estimate of the probability of a positive or negative immunochromatographic RSV test being truly positive or negative. To use this graph the reader must first estimate the pretest probability that the patient truly hasRSV. If the antigen test is positive the user draws a straight line from the pre-test probability line through the likelihood ratio (LR) positive and continues the line through the post-test probability line to read off the post test probability that the patient has RSV. If the antigen test is negative the reader draws the line from the pre-test probability through the LR negative through the post test probability line to read off the post-test probability that the patient has RSV. EDs that treat very few infants even during bronchiolitis season may rely on this rather than the more complex model in figure 5.

