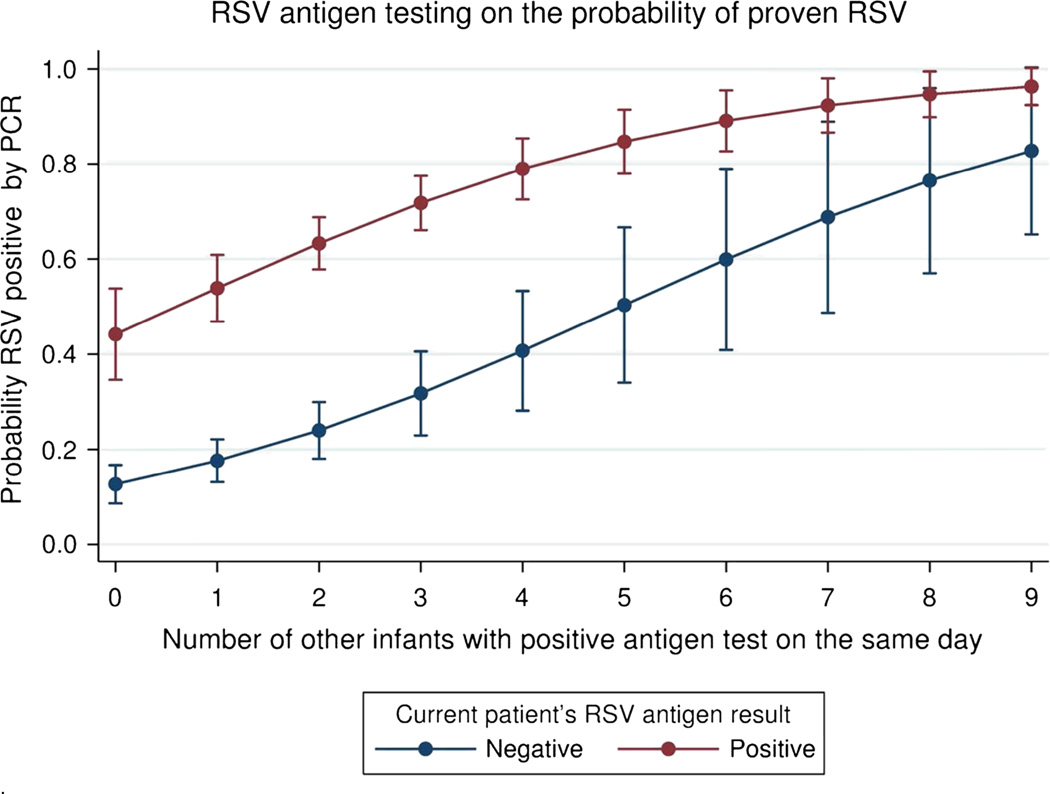
Figure 4.
This graph shows the marginal effect on probability of PCR proven RSV based both on the infants own antigen test result and the number of other children who tested positive within 24 hours of the index case. This graph demonstrates the concept that as cases of bronchiolitis increase does the probability that RSV is the aetiology. This model does not take into account the effect of prior negative test results. For clinical application figure 5 should be used.

