
Figure 4.
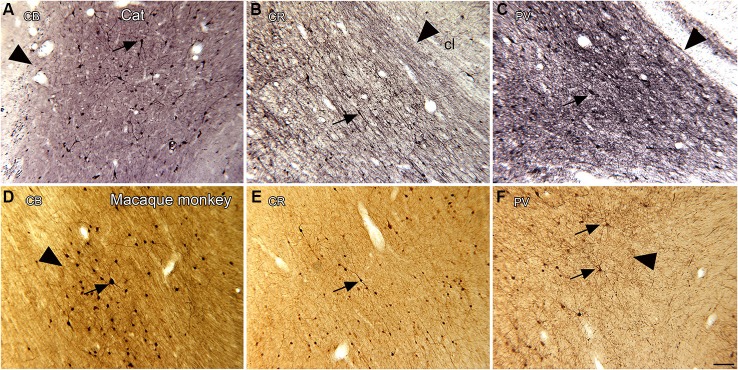
Spacing and density of neurons in the claustrum of the cat (A, B, C) and macaque monkey (D, E, F) claustrum that are immunoreactive for the calcium-binding proteins. (A) CB, cat. The arrowhead indicates the medial border of the claustrum; the arrow indicates a labeled cell. (B) CR, cat. The arrowhead shows the border of the claustrum and the arrow a cell with a fusiform soma. (C) PV, cat. The claustrum is darkly stained; the border (arrowhead) is very clear. The arrow shows a PV-ir neuron. A, B, C glucose oxidase modification of DAB for visualization of immunoreactivity. (D) CB, monkey. The arrowhead shows the border of the claustrum, the arrow a labeled neuron. (E) CR, monkey. The arrow shows a neuron with an elongated soma. (F) PV, monkey. The arrowhead shows the edge of the claustrum. The arrows show two large neurons and their dendrites. D, E, F, standard DAB visualization of immunoreactivity. Scale bar: F = 100 μm; same magnification for all other panels. Abbreviations: CB, calbindin; CR, calretinin; PV, parvalbumin.