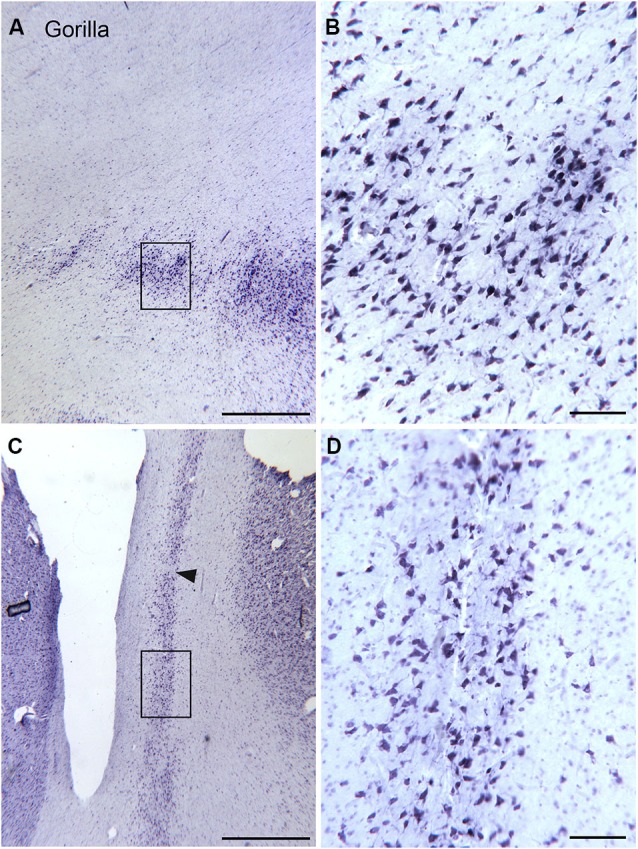
Figure 8.

Size shape and density of neurons in the claustrum of the gorilla at different rostro-caudal and dorso-ventral levels. (A) Cell islands in the dorsal claustrum (section outlined on Figure 7A). The rectangle shows the location of the image in (B). (B) Stained somata in the claustrum; many somata are multipolar. Scale bar = 100 μm. (C) Image of the more ventral and caudal claustrum; the section was outlined in Figure 7E. The rectangle shows the location of the image in (D). The arrowhead indicates a cell-sparse region. (D) Somata in the ventral and caudal claustrum; many are multipolar. Scale bars: A, C = 1 mm; B, D = 100 μm.
