
Figure 3.
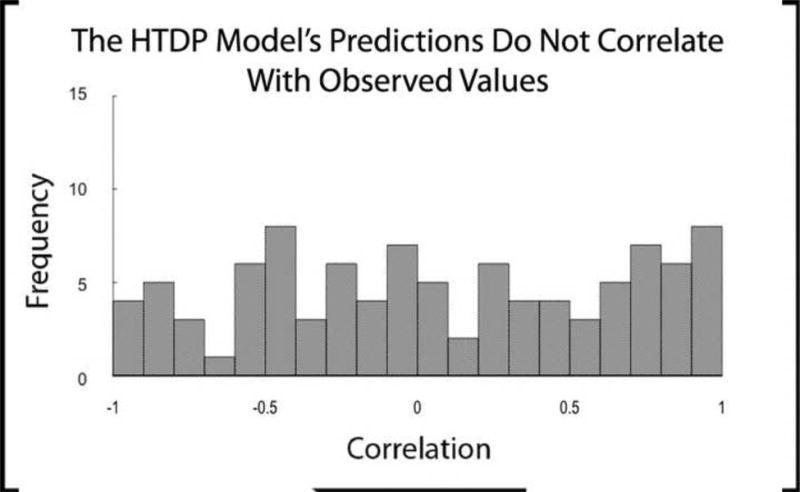
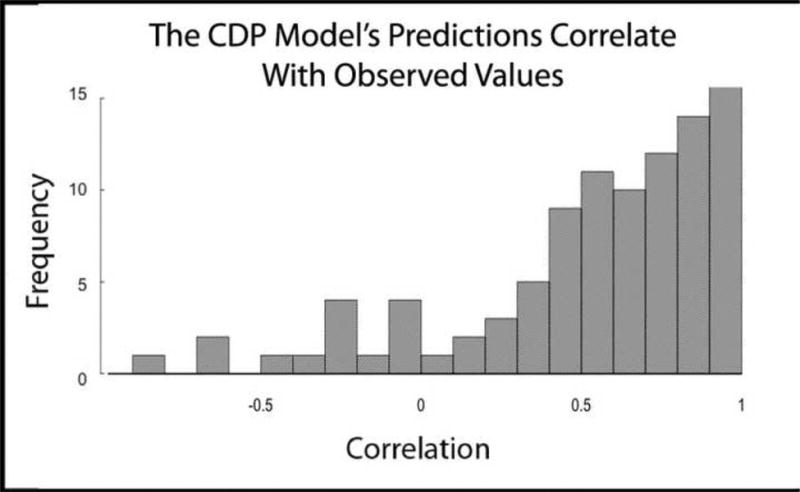
Distribution of correlation values (one value for each of 97 participants) between the errors generated by fitting one model to the data and the errors predicted by the other model. A. The CDP model's predictions of error are well correlated with the errors generated by the HTDP model. B. The HTDP model's predictions of error are not well correlated with the errors generated by the CDP model.