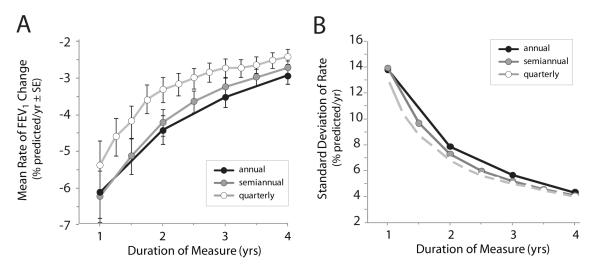
Figure 1. Effect of frequency and duration of measure on estimated means and standard deviations of rate of FEV1 change.
Panel A, estimated mean rates of FEV1 change as a function of duration of measure beginning at the index visit. Bars represent standard errors (SE) around each mean. Panel B, observed standard deviations for estimated rates of FEV1 change in Panel A. Estimates are derived using annual (black circles), semiannual (gray circles), and quarterly (white circles) FEV1 measures.

