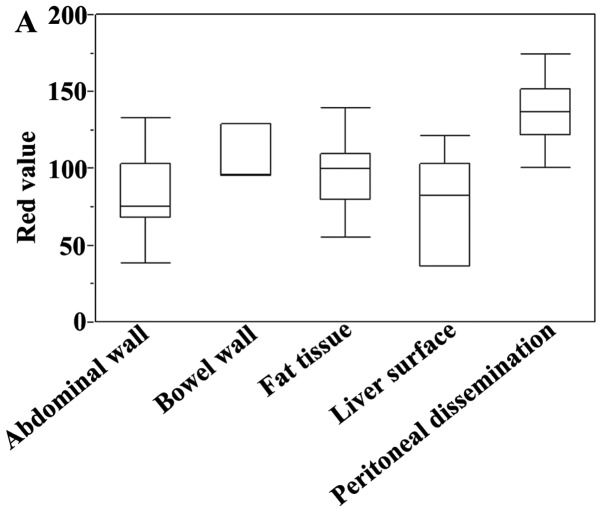
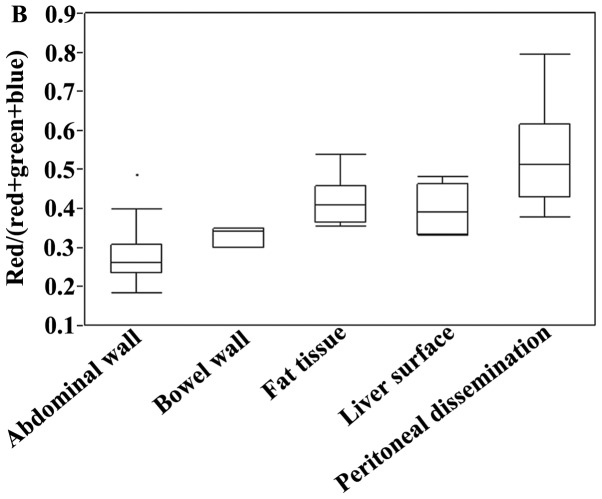
Figure 3.
Box-and-whisker plots of a quantitative analysis of 5-ALA-induced fluorescence images. The red value of each 24-bit RGB color image was evaluated with a corresponding index for red fluorescence. The maximum red value of each peritoneal metastatic nodule and non-metastatic site of the abdominal wall, fat, and liver were compared (A). The red/(red + green + blue) ratio was also evaluated to correct for differences in the imaging conditions (B).


