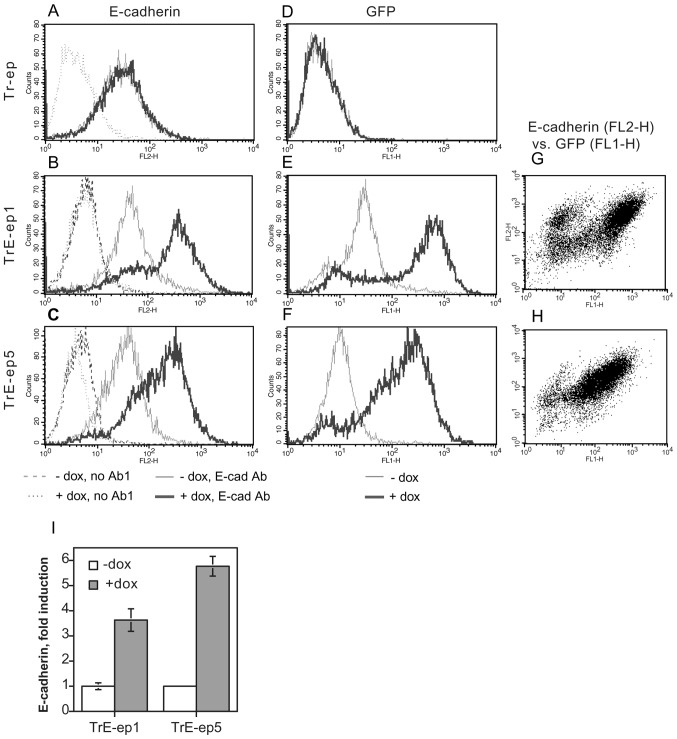
Figure 1.
Expression of GFP and E-cadherin in HB2/tnz34 cells expressing the tetracycline repressor only (Tr-ep, A and D) or the tetracycline repressor plus the tetracycline operator-controlled E-cadherin-IRES-GFP construct (TrE-ep1, B, E and G; and TrE-ep5, C, F and H). Expression was analysed by flow cytometry 2 days after ectopic E-cadherin expression was induced by addition of doxycycline (dox) where indicated. E-cadherin was assayed in non-permeabilised cells by the HECD-1 mAb and an RPE-conjugated secondary antibody (FL-2) whereas GFP was measured in the FL-1 channel. (G and H) GFP vs. E-cadherin fluorescence in dox-treated samples. (A–H) Representative data from experiments performed at least three times. (I) Fold induction of E-cadherin expression upon dox treatment, based on mean fluorescence values averaged over at least three independent experiments. Error bars, SEM.

