Figure 2.
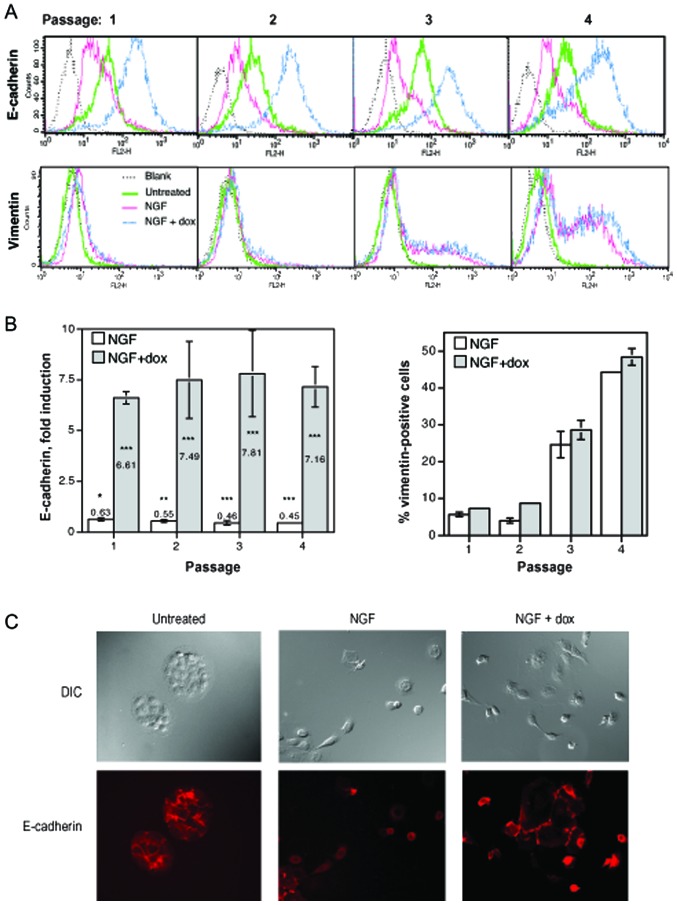
c-erbB2-induced EMT in cells with and without ectopic E-cadherin expression. (A) Representative histograms from flow cytometry measurements of E-cadherin and vimentin expression in TrE-ep5 cells passaged at low density as outlined under EMT assays in Materials and methods with NGF (to induce c-erbB2 signalling), dox (to induce E-cadherin expression) + NGF, or untreated. (B) Summary of two independent EMT assay experiments. Fold induction of E-cadherin was calculated as the ratio between the mean fluorescence intensity of the sample cells (white bars, NGF; grey bars, NGF + dox) relative to that of untreated cells. The statistical significance of the changes in E-cadherin expression relative to control cells was analysed as described in Materials and methods and is denoted by the asterisks in the graph (*p<0.05; **p<0.02; ***p<0.01). Vimentin-positive cells were defined as described in Materials and methods. The experiments shown in (A) and (B) have also been performed with TrE-ep1 cells, with similar results. (C) Representative micrographs showing DIC and E-cadherin immunofluorescence in TrE-ep5 cells grown at low density for 5 days in the presence of NGF, NGF + dox or untreated. Note that in all experiments, E-cadherin was measured in nonpermeabilised cells in order to exclusively detect the plasma membrane-associated fraction of this protein.

