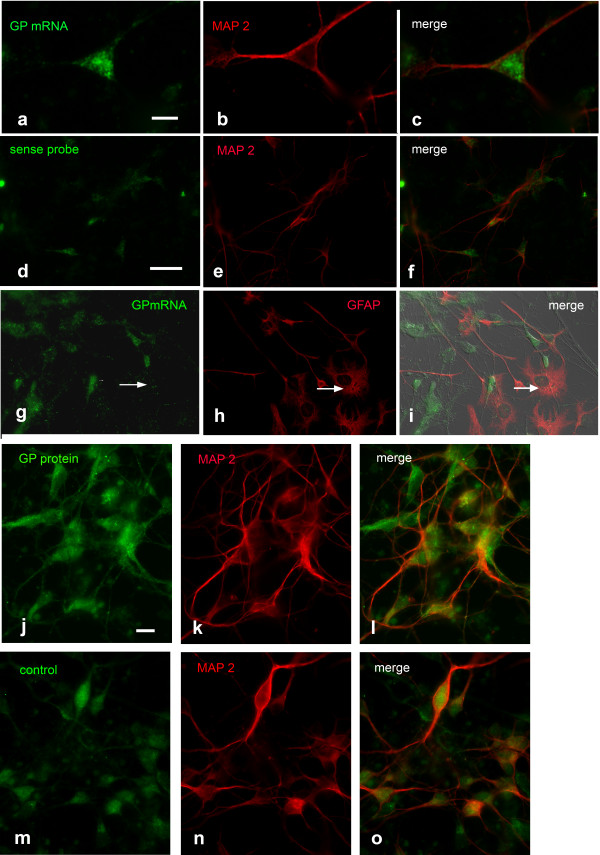
Figure 4.

Upper panel (a-i): Detection of GP mRNA in cortical neuronal cultures, 6 DIV. Combination of GP FISH with MAP 2 ICC reveals a weak FISH signal (a-c). d-f Negative control applying sense probe combined with MAP 2 ICC. g-i GP FISH combined with GFAP ICC. The arrows point to a GFAP positive astrocyte not expressing GP mRNA. Lower panel (j-o): Detection of GP protein in cortical neuronal cultures, 6 DIV. Double-labeling for GP with MAP 2 (j-l) reveals a weak signal for GP similar to that in the negative control (m-o). Co-staining with rabbit normal serum in combination with MAP 2 antibodies indicates background staining level. Bar in a = 10 μm and applies to a-c, bar in d = 20 μm and applies to d-i, bar in j = 10 μm and applies to j-o.
