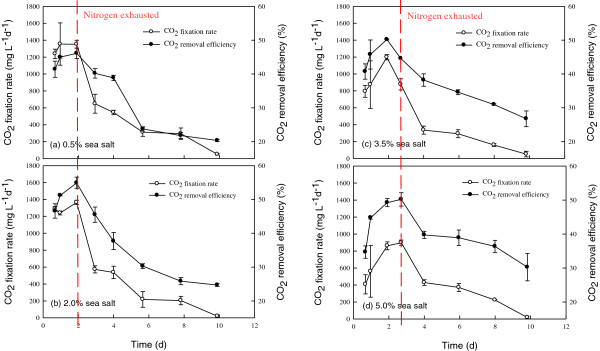
Figure 4.

Time course profiles of CO2 fixation rate and CO2 fixation ability during growth of Chlamydomonas sp. JSC4 on Modified Bold 3 N medium under the sea salt concentration of (a) 0.5%, (b) 2.0%, (c) 3.5%, and (d) 5.0%. Error bars indicate standard deviation of three replicated experiments. (Light intensity = 200 μmol m-2 s-1; CO2 aeration = 2.0%; CO2 flow rate = 0.05 vvm).
