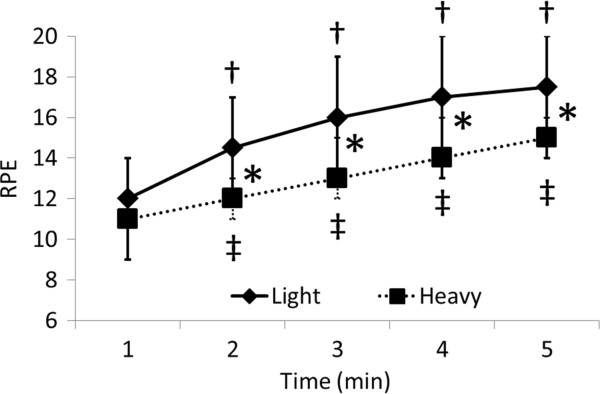
Figure 6.

Comparison of RPE between light and heavy groups. Values are shown as medians and max-min. Significant difference between light and heavy groups (*P <0.05; Mann-Whitney U test) and between 1 min and subsequent times in light (†P <0.05; Wilcoxon sign rank test) and heavy (‡P <0.05; Wilcoxon sign rank test) groups. RPE, rating of perceived exertion.
