Figure 1.

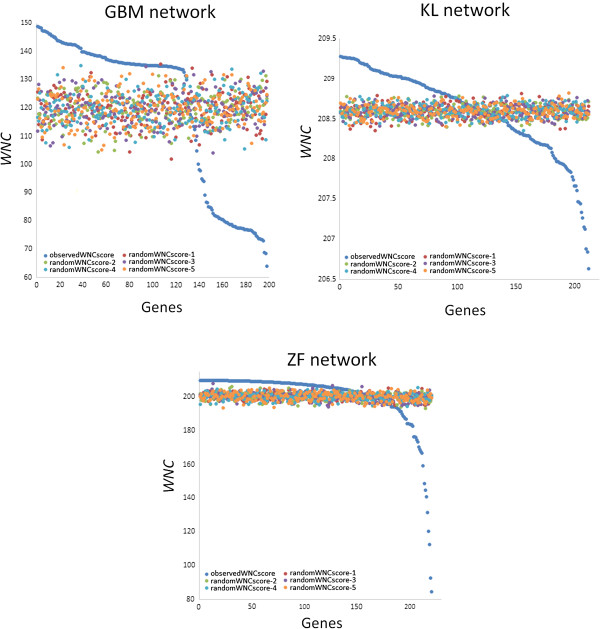
Distribution of WNC scores in real and permuted co-expression networks.WNC values from the real and permuted networks are color-coded. To give a sense of the distribution of random samples, the results from 5 permuted networks are shown.

Distribution of WNC scores in real and permuted co-expression networks.WNC values from the real and permuted networks are color-coded. To give a sense of the distribution of random samples, the results from 5 permuted networks are shown.