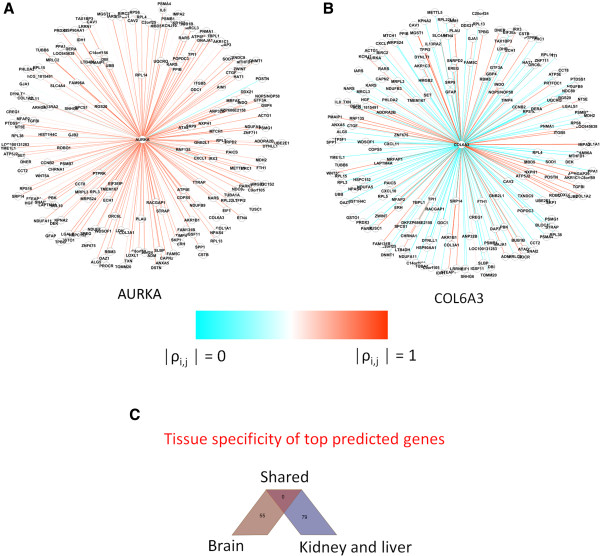
Figure 3.

Examples of top genes with highly significant WNC scores in the GBM network. Genes detected with WNC scores are shown as central nodes with their respective co-expression relationships. Panel A shows an example of gene with significant WNC score (AURKA, P = 0). Example of a gene with a statistically spurious WNC (COL6A3, P =1) is shown in B. Edges are color-coded to reflect the intensity of the gene co-expression values. C: top predicted genes from GBM and KL networks do not overlap, which suggest tissue specificity of the observed associations.
