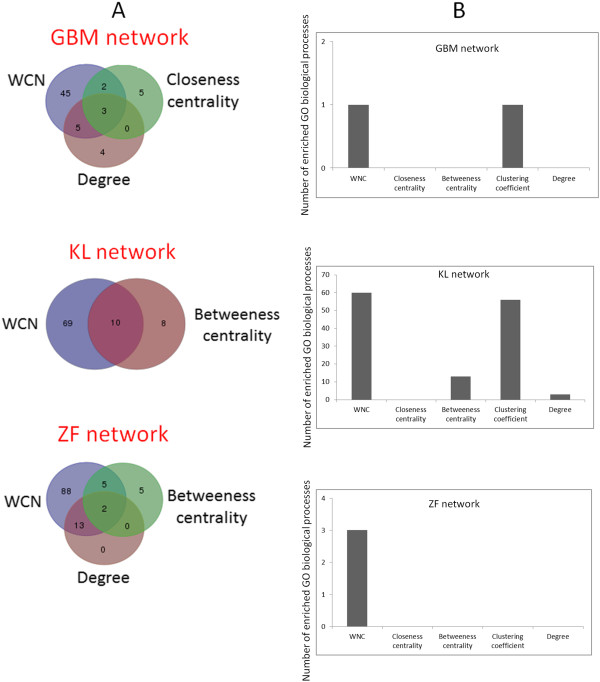
Figure 4.

Comparison of gene sets identified by WNC and standard centrality scores. A. Venn diagrams depicting overlaps between the gene sets identified by the different methods. Only the largest overlaps with WNC are shown to facilitate visualization. B. Statistically significant GO enrichments found in the predicted gene sets.
