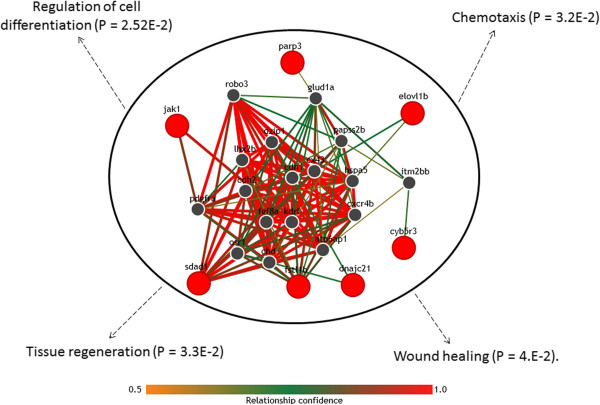
Figure 6.

Computational prediction of associations between the top candidates in the ZF network and diverse biological processes. High-confidence associations with genes and cellular processes obtained from the IMP analysis. In the network, red nodes represent genes predicted as top candidates in the ZF network using significant WNC scores. Grey nodes represent other genes predicted by IMP to be functionally associated with the top ZF network genes. Color bar indicates the level of statistical confidence of the predicted gene-gene associations. Examples of biological processes significantly enriched in this predicted network are indicated.
