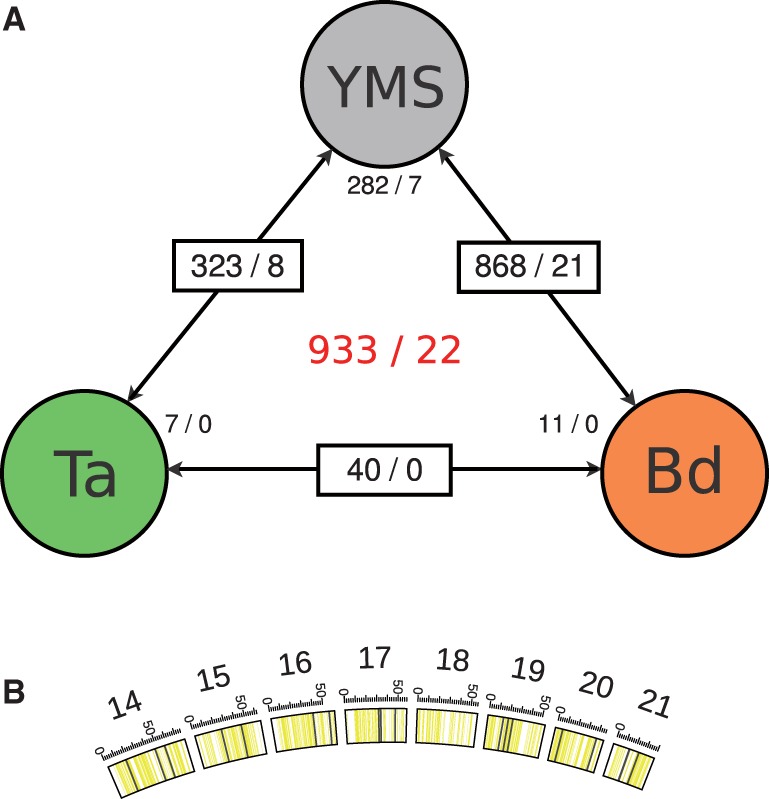
Fig. 2.—

Zymoseptoria tritici genes differentially expressed between axenic culture and growth in planta. (A) Each box reports results of a comparison between expression profiles from the indicated two cultures: axenic growth in yeast malt sucrose medium (YMS), infection of T. aestivum (Ta), and infection of B. distachyon (Bd). In a given box, the value before the slash reports the number of genes on core chromosomes differentially expressed at a false discovery rate of 0.01 or less between the indicated conditions, and the value after the slash reports the analogous quantity from accessory chromosomes. Small text next to a given circle reports the number of genes differentially expressed between the indicated condition and both of the other two, on core chromosomes (before the slash) and accessory chromosomes (after the slash). Red text at center reports the total numbers of genes differentially expressed in any comparison, on core chromosomes (before the slash) and accessory chromosomes (after the slash). (B) Distribution of differentially transcribed genes (black solid lines) along ACs. Boxes depict single chromosomes with regions containing transcripts drawn in yellow. Scaling: 50 = 0.5 Mb.
