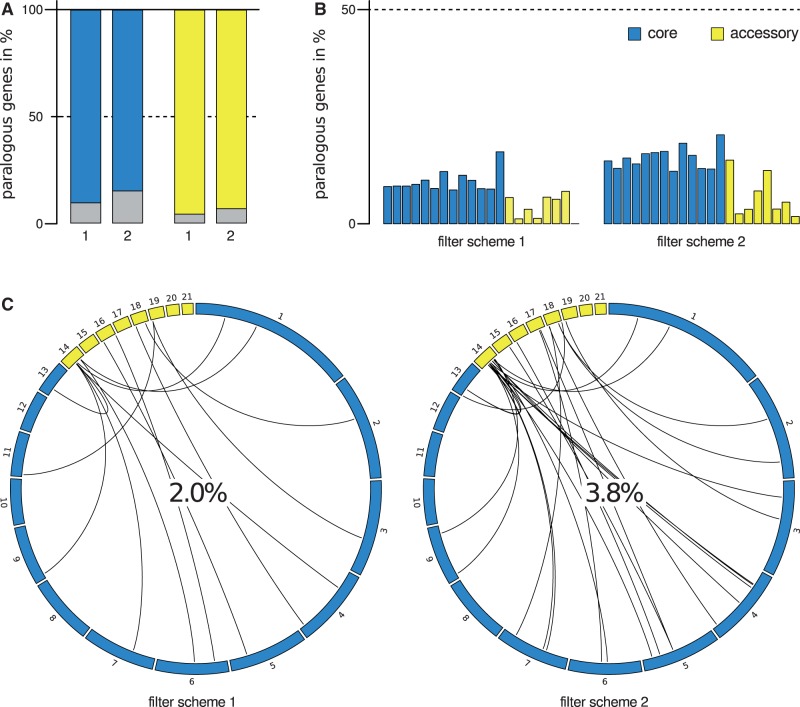
Fig. 6.—
Paralogous and unique genes of the Zymoseptoria tritici isolate IPO323. (A) Each set of bars reports the distribution of genes on one class of Z. tritici chromosomes that fall into paralogous gene families. The height of each colored bar reports the proportion of genes falling into gene families under one scheme for definition of the latter (schemes 1 and 2; see Methods for details). (B) Data are as in (A), except that a given set of bars reports the proportion of genes falling into paralogous gene families on each chromosome in turn, with bars from left to right reporting results from the lowest to highest numbered chromosomes of the indicated class. (C) Each panel reports analysis of paralogous gene families that include genes on accessory chromosomes, from one paralogy filter scheme. In a given panel, each curved line reports the paralogy relationship between a gene on an accessory chromosome (yellow) and the most closely related gene of its family on a core (blue) chromosome; the value at center reports the total proportion of genes on accessory chromosomes that fall into families also containing genes on core chromosomes.

