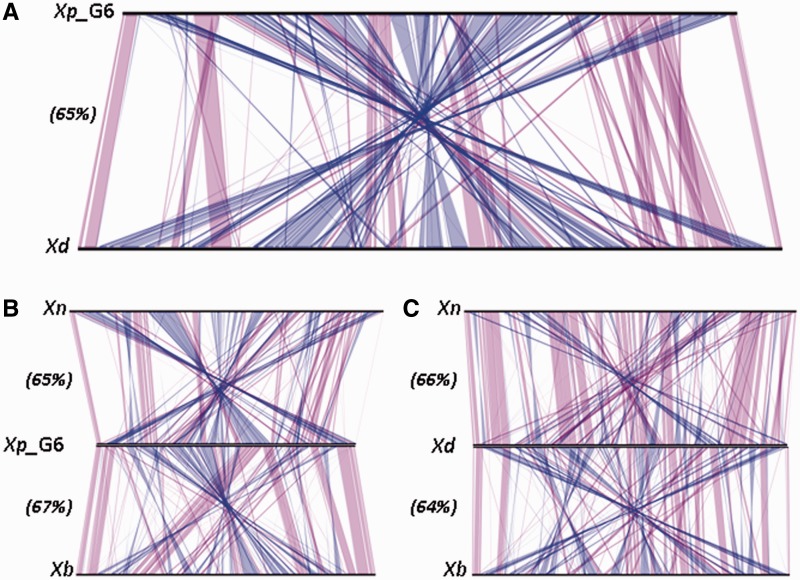
Fig. 3.—
Whole-genome sequence alignments between Xenorhabdus genomes. The line plots were obtained with the results for synteny between (A) X. poinarii G6 (Xp_G6) and X. doucetiae FRM16 (Xd); (B) Xp_G6, Xn, and Xb; (C) Xd, Xn, and Xb. Matches between synteny groups occurring on the same strand are shown in purple; matches between synteny groups occuring on the opposite strand are shown in blue. Numbers in brackets indicate the percent of CDS in synteny for each whole-genome alignment.

