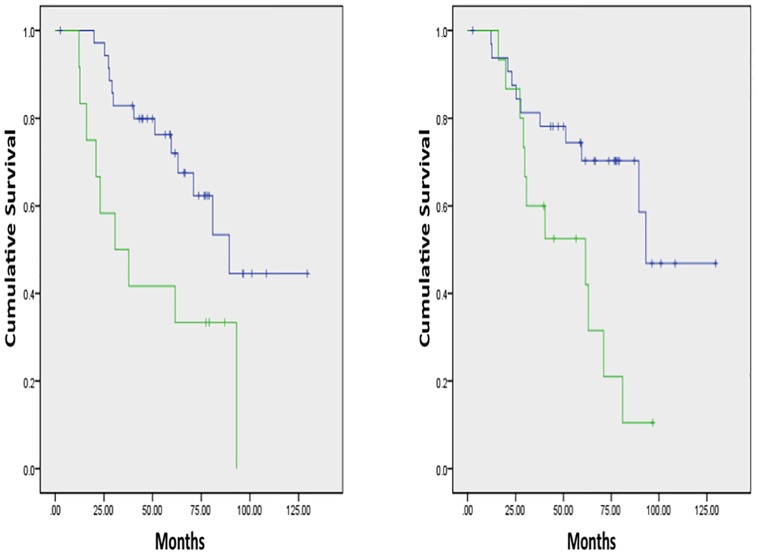
Figure 3. Overall survival curves based on QTA.
A) (Left Panel): Without filtration, higher skewness (green line, median OS 30.7 months) vs. lower skewness (blue line, median OS 89.4 months) was associated with inferior OS (p = 0.012). B) (Right Panel): Without filtration, lower kurtosis (green line, median OS 61.6 months) vs. higher kurtosis (blue line, median OS 93.2 months) was associated with inferior OS (p = 0.012).

