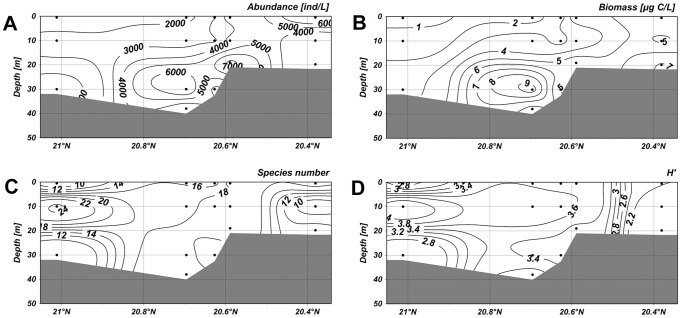
Figure 8. Vertical distribution of planktonic ciliates in the section 3–20.
(A) Vertical distribution of abundance. (B) Vertical distribution of biomass. (C) Vertical distribution of species number. (D) Vertical distribution of diversity. The horizontal axis and vertical axis expressed the gradients in latitude and water depth, respectively. (TIFF).

