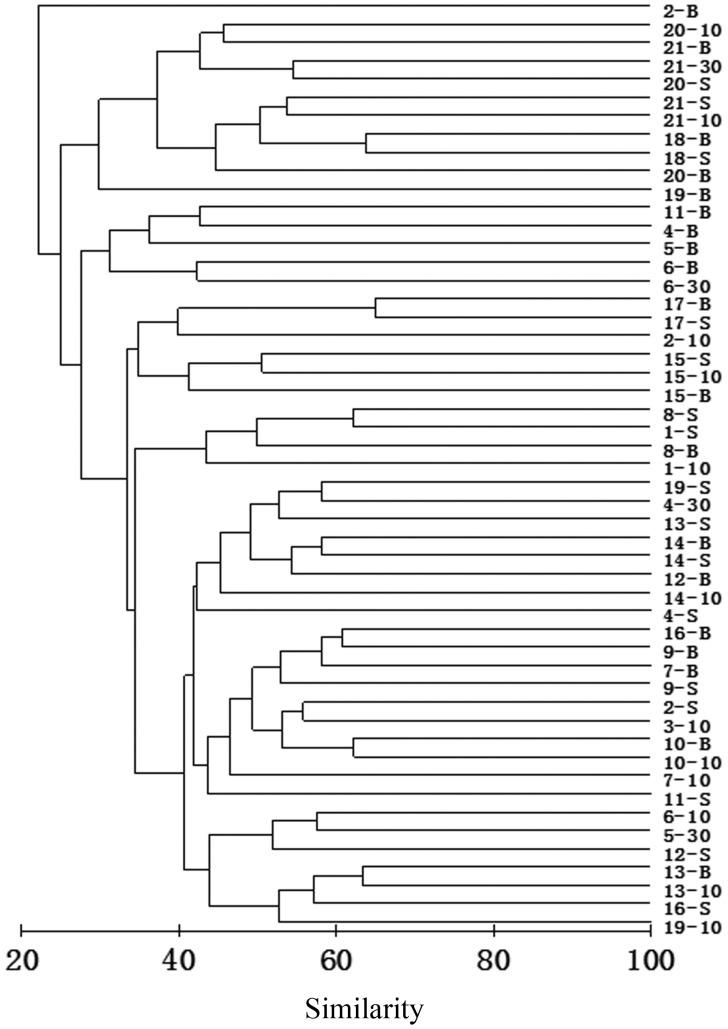
Figure 9. Result of cluster analysis.
The result was based on Bray-Curtis similarities from square root-transformed biotic data of 51 effective samples in the northern Beibu Gulf in August 2011. The numbers indicated the sampling stations. -S = surface-layer sample; −10 = 10 m-layer sample; −30 = 30 m-layer sample; -B = bottom-layer sample. (TIFF).

