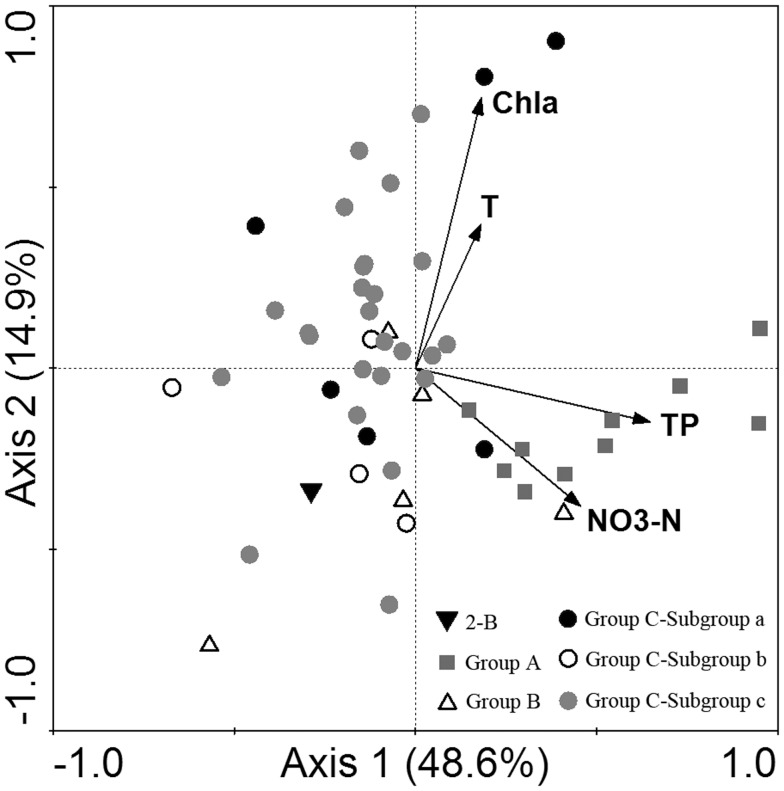
Figure 10. Redundancy analysis (RDA) ordination plot.
The ordination plot shows the relationship between ciliate communities and significant environmental variables. The result was based on square root-transformed biotic and log-transformed abiotic data of 51 effective samples in the northern Beibu Gulf in August 2011. Axis 1 and Axis 2 explained 48.6% and 14.9% of the species-environment relationship respectively. T-water temperature; Chl a- chlorophyll-a; Sal-salinity; 2-B = bottom sample of station 2. (TIFF).

