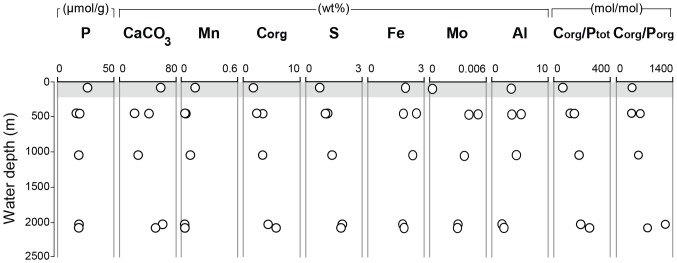
Figure 3. Trends with water depth for key characteristics of the sediment.

Values are averages for the total analyzed Unit I section per multicore. The grey area indicates the part of the water column that is oxic.

Values are averages for the total analyzed Unit I section per multicore. The grey area indicates the part of the water column that is oxic.