
Figure 1. Quantification of ASH1 mRNA Distributions in Wild-Type and ΔSHE2 Budding Yeasts.
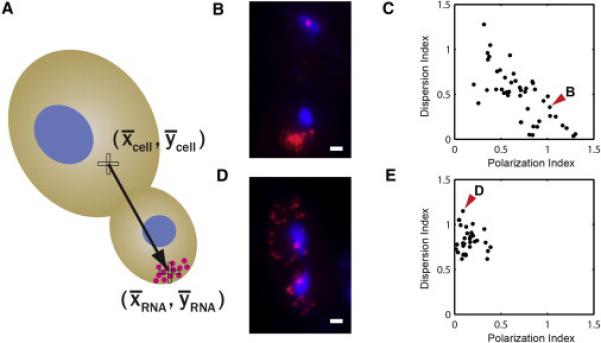
(A) A schematic showing the polarization vector of mRNA distribution pointing from the centroid of the cell to the centroid of the single mRNA positions.
(B) Overlay image of ASH1 mRNA molecules (magenta), and nuclei (blue) in a wild-type cell. ASH1 mRNAs localize to the daughter bud tip. Scale bar represents 1 μm.
(C) Scatter plot of polarization index in x axis and dispersion index in y axis for wild-type cells.
(D) Overlay image of ASH1 mRNA molecules, and nuclei in a ΔSHE2 cell. Deletion of She2p causes a complete delocalization of ASH1 transcripts. Scale bar represents 1 μm.
(E) Scatter plot of polarization index versus dispersion index for ΔSHE2 cells. The red arrow heads indicate the data points for the cells shown in (B) and (D).
See also Figure S1.