
Figure 2. Comparison of GAPDH and β-Actin mRNA Distributions in Chicken Embryonic Fibroblasts.
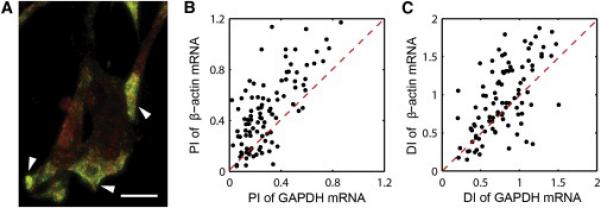
(A) FISH image of GAPDH mRNA (red), and β-actin mRNA (green). Scale bar represents 10 μm.
(B) Scatter plot of polarization index for GAPDH mRNA in x axis and β-actin mRNA in y axis.
(C) Scatter plot of dispersion index for GAPDH mRNA in x axis and β-actin mRNA in y axis. Red dashed lines indicate cells that have the same index for GAPDH and β-actin mRNA.
See also Figure S2.