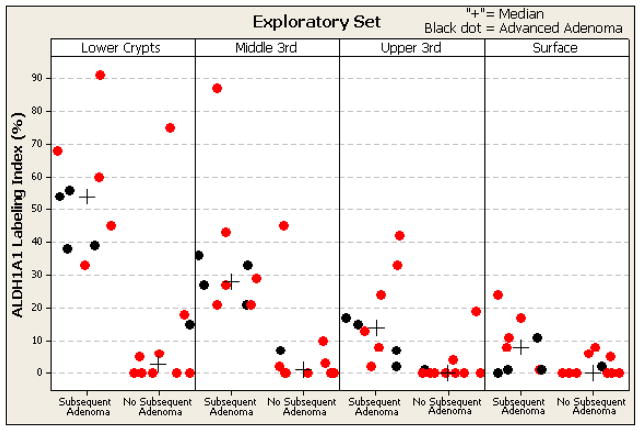
Figure 2. Topographical Expression of ALDH1A1 in 19 polyps in relation to metachronous adenoma development.
ALDH1A1 labeling index by manual immunohistochemistry and morphometric analysis is shown for each subject. The ALDH1A1 labeling index for each of the four topographic sites (lower third, middle third and upper third of crypts and surface epithelium) is shown for non-advanced adenomas (red dots) and advanced adenoma (black dots) grouped by development of a subsequent adenoma. The subjects with a metachronous adenoma have significantly higher median ALDH1 values (indicated by +): 53.8% vs. 11.9%, p=.002, for deep glands; 34.5% vs. 6.7%, p=.002, for middle glands; 16.3% vs. 2.4%, p=.002, for upper glands; 8.2% vs. 2.1%, p=.03, for surface epithelium.

