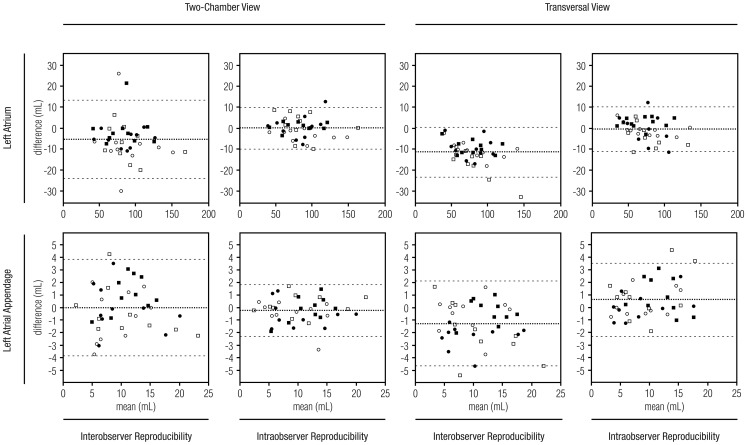
Figure 2. The reproducibility of volume measurements.
Bland-Altman plots show the reproducibility of 40 left atrium and 40 left atrial appendage volume measurements for the same observer and different observers in two-chamber view and the transversal view. The X-axis shows the mean of two volume measurements and the y-axis shows a difference between respective measurements. The middle line corresponds to the mean difference and the outer lines correspond to the 95% confidence interval. Filled squares (▪) indicate cardiac computed tomography images with excellent image quality; filled circles (•) indicate good image quality; empty circles ( ), moderate image quality; and empty squares (□), poor image quality. Volume size and image quality had no significant influence on interobserver or intra-observer measurements in either orientation.

