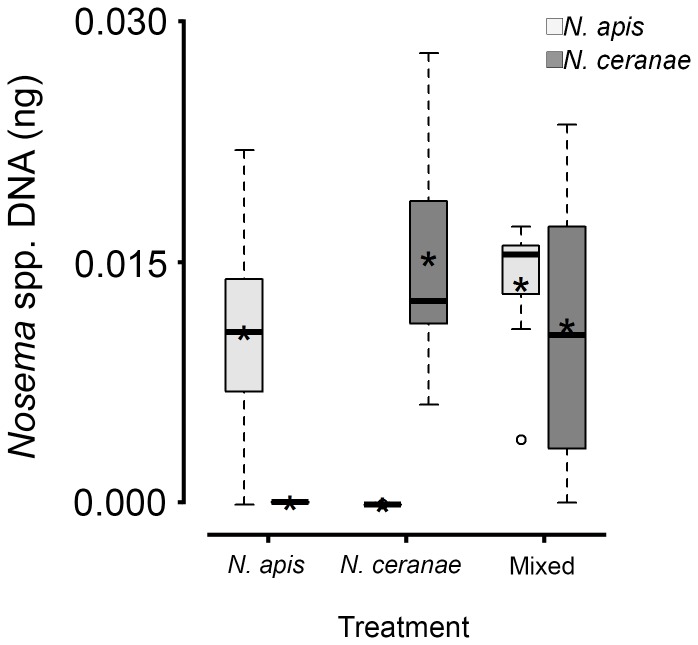
Figure 4. Levels of Nosema apis and Nosema ceranae DNA (square root-transformed) in adult worker western honey bees (Apis mellifera) that died between 28 and 30 d post inoculation in N. apis, N. ceranae or mixed N. apis/N. ceranae treatments (same workers shown in Fig. 3 ).
Boxplots show interquartile range (box), median (black or white line within interquartile range), data range (dashed vertical lines), and outliers (open dots); asterisks (black or white) represent means. No significant differences were observed in quantities among the four instances where we expected to find DNA (i.e., the boxes with means above 0).

