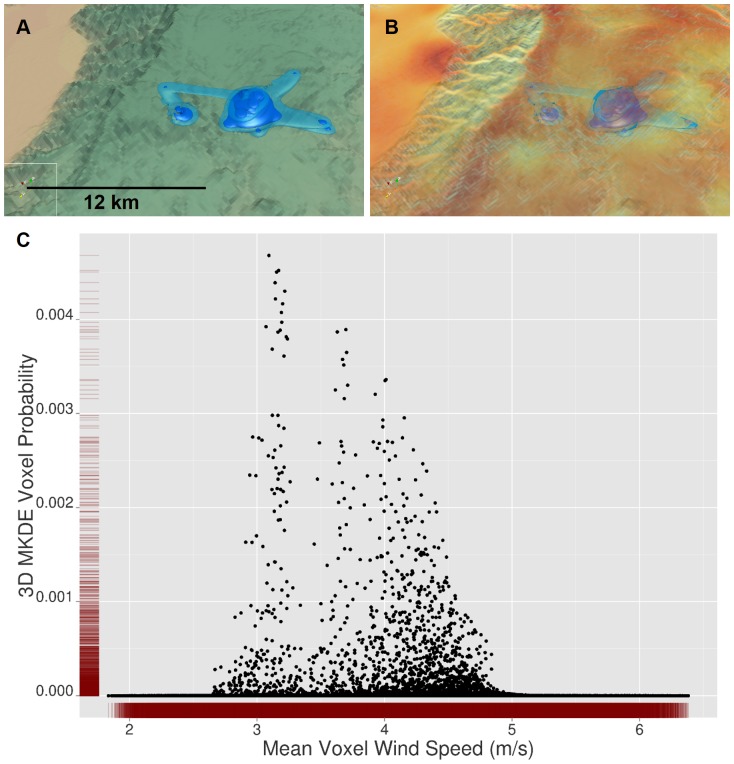
Figure 6. 3D MKDE Voxel Probabilities and 3D Covariates.
Like 2D utilization distributions (UDs), 3D UDs can be related to 2D and 3D habitat covariates. In A, we show the 99% and 95% contour volumes for an adult female condor during the month of November, 2009. In B, we show a volume rendering for predicted mean wind speed (meters/second) for November 2009 in voxels 250 m by 250 m by 10 m (x, y, z, respectively) for 0 to 150 m above the ground. Wind speed increases as the color transitions from pale yellow to red. In C, we relate the probability of the condor being in a voxel to the predicted voxel wind speed for each voxel within 150 meters of the Earth's surface. Rug plots (in red) show the marginal distribution of each variable.

