Figure 3.

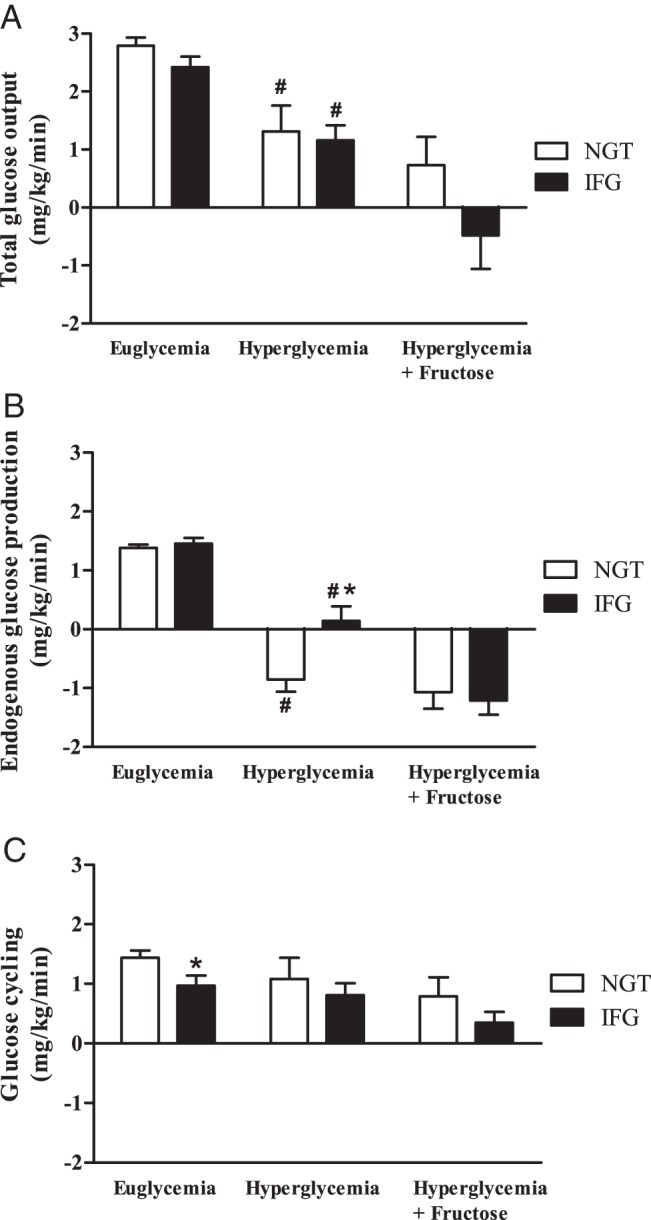
A, Total glucose output as measured by the [2-2H]glucose Ra. B, EGP was determined using the [6,6-2H2]glucose Ra. C, Glucose cycling ([2-2H]glucose, [6,6-2H2]glucose Ra). *, P < .05, NGT vs IFG; #, P < .05 vs euglycemia.

A, Total glucose output as measured by the [2-2H]glucose Ra. B, EGP was determined using the [6,6-2H2]glucose Ra. C, Glucose cycling ([2-2H]glucose, [6,6-2H2]glucose Ra). *, P < .05, NGT vs IFG; #, P < .05 vs euglycemia.