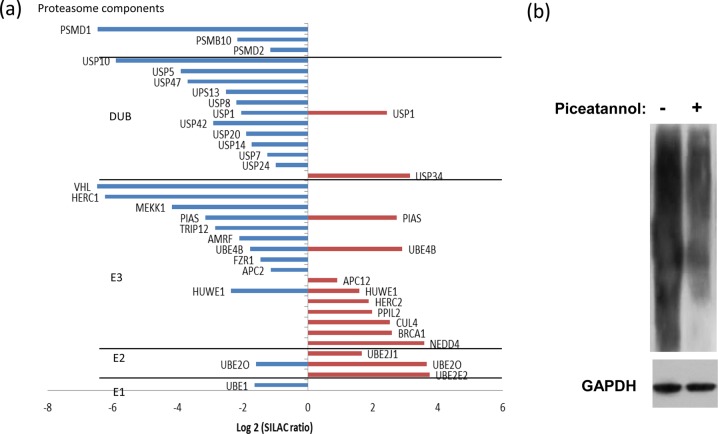
Figure 4.
(a) Phosphorylation on ubiquitin proteasome pathway proteins. The plot indicates the SILAC fold changes (x axis) of E1, E2, E3 ligases, deubiquitinases, and proteasome components. Positive and negative values represent phosphorylation increase and decrease, respectively. Western blots indicating Syk dependent ubiquitination. (b) Anti-ubiquitin Western Blot of proteins from DG75 B cells treated without (−) or with (+) piceatannol. GAPDH was used as the loading control.

