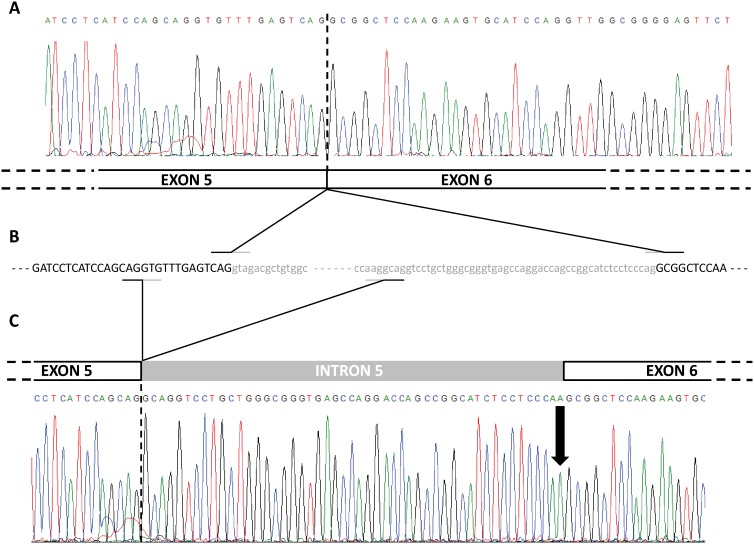
Figure 2. Sequencing representation of the cDNA analysis.
(A) Chromatogram and schematic representation of the non-mutated exon 5 and 6 junction. (B) Partial gDNA sequence of exon 5, intron 5 and exon 6. Finally, (C) chromatogram and schematic representation of the mutated allele, including exon 5, part of intron 5 and exon 6. The arrow indicates the mutation.

