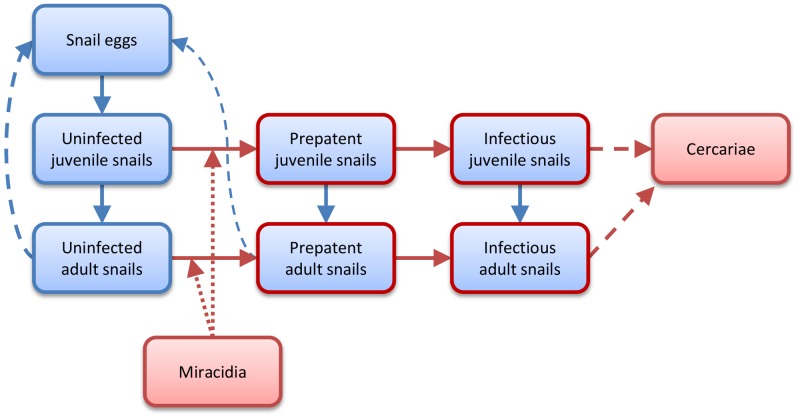
Figure 1. Diagram of the model structure.
Boxes show types of agents. Solid arrows show where agents can change from one type into another. Dashed lines show the production of one type of agent by another. Dotted lines indicate infection. Red outlines and arrows indicate the presence of schistosomes. Agents of all types can die and be removed from the model.

