
Figure 2.
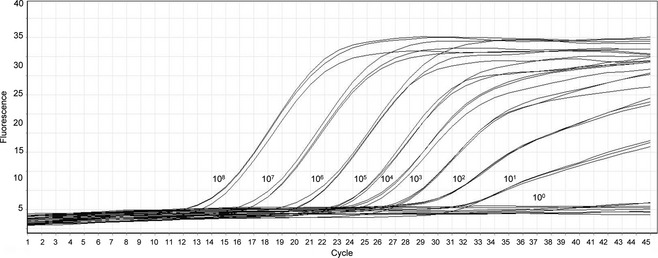
Results of real‐time PCR to determine the sensitivity of the second nested PCR. The triplicate dilutions of the positive control, in copies per reaction, are depicted. Y‐axis, normalized fluorescence; X‐axis, cycle number.
Official websites use .gov
A
.gov website belongs to an official
government organization in the United States.
Secure .gov websites use HTTPS
A lock (
) or https:// means you've safely
connected to the .gov website. Share sensitive
information only on official, secure websites.
Results of real‐time PCR to determine the sensitivity of the second nested PCR. The triplicate dilutions of the positive control, in copies per reaction, are depicted. Y‐axis, normalized fluorescence; X‐axis, cycle number.