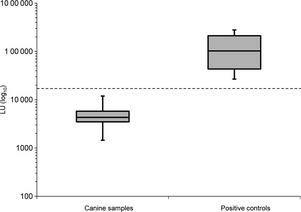
Figure 3.

Box and whiskers plot showing the mean results of an LIPS assay for the detection of anti‐NS3 CHV antibodies in 100 dogs with chronic hepatitis (canine samples) and from known positive equine samples (positive controls). The Y‐axis depicts the antibody titres in light units (LU) on a log10 scale. The boxes represent the interquartile intervals from the 25th to 75th percentiles, and the solid horizontal bars through the boxes represent the medians. The capped vertical bars represent the minimum and maximum of all data. The horizontal dotted line shows the cut‐off limit derived from the combined value of the mean value plus 3 standard deviations (SD) of negative control samples.
