Figure 1.
Genome-Wide Distribution of phyA Association Sites and phyA-Regulated Genes.
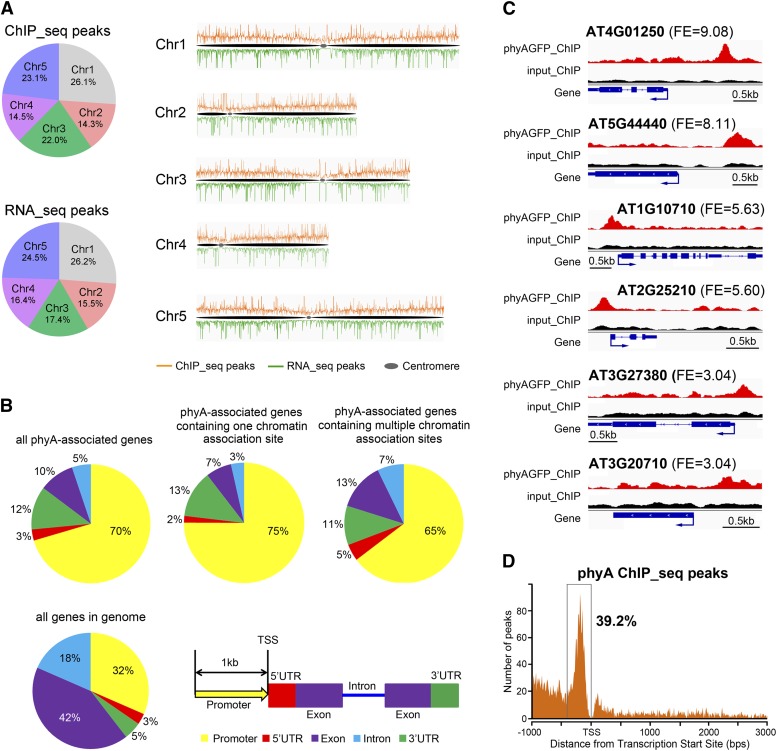
(A) Distribution of phyA association sites and phyA-regulated genes across the five Arabidopsis chromosomes. ChIP-seq peaks indicate the phyA association sites; RNA-seq peaks indicate the phyA-regulated genes. The numbers in the pie charts indicate the percentage of peaks in each chromosome.
(B) Distribution of phyA association sites within genic regions. A 1-kb region before the transcription start site (TSS) is defined as the promoter region. If a peak covers two adjacent gene regions, it is counted into the region that contains more than 50% of the peak length. If each of two adjacent regions contains exactly 50% of a peak length, the peak is counted following this priority: 5′ UTR > promoter > 3′ UTR > exon > intron. The distribution of individual gene regions in all genomic genes is shown as a control.
(C) Representative phyA association sites on the gene promoter region. The top, middle, and bottom two genes exhibit phyA peaks with high, moderate, and low fold enrichment (FE), respectively. For each gene, phyA peaks in the phyA ChIP sample (red), the input control sample (black), and the gene structure (blue) are shown in the top, middle, and bottom rows, respectively. Bars = 0.5 kb.
(D) phyA association sites are highly enriched in a 400-bp region immediately upstream of the transcription start site.

