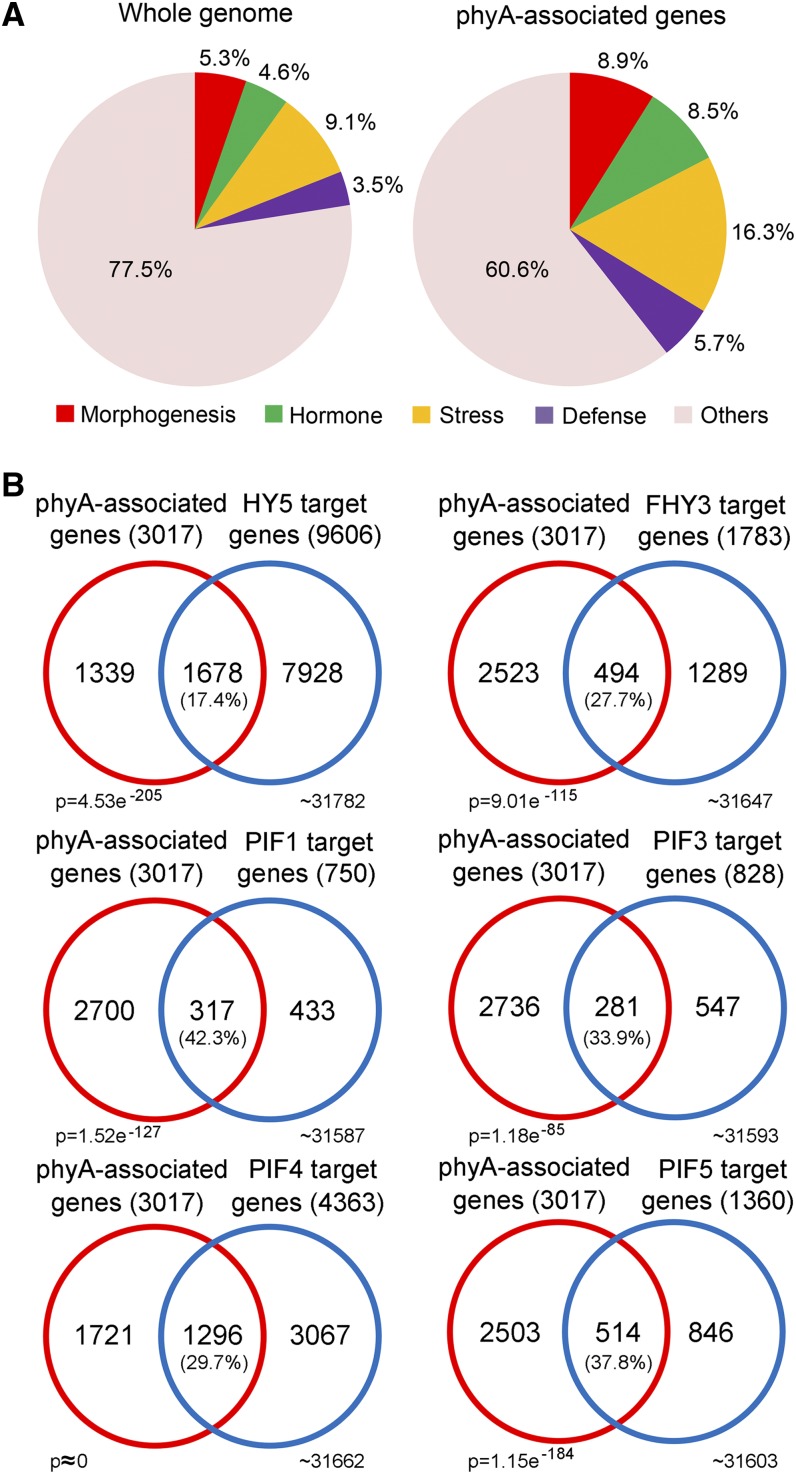
Figure 2.
Functional Analysis of phyA-Associated Genes.
(A) Functional classification of phyA-associated genes enriched compared with the whole genome.
(B) Overlap of phyA-associated genes with known target genes of several light-responsive transcription factors. Percentage values indicate the percentages of genes targeted by transcription factors that overlapped with phyA. P values were calculated using the hypergeometric distribution.

