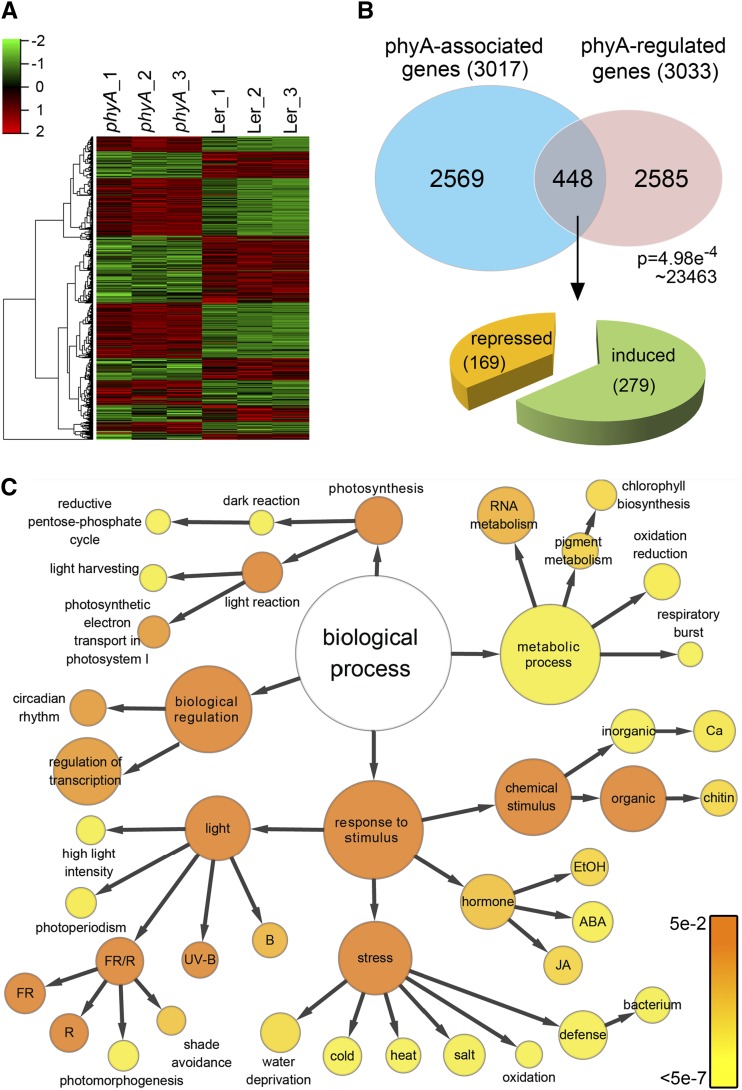
Figure 3.
Identification of phyA Direct Target Genes by Merging RNA-seq Data and ChIP-seq Data.
(A) Hierarchical clustering of differentially expressed genes in wild-type (Ler) seedlings and phyA mutant lines. All three biological replicates of RNA-seq are shown.
(B) Venn diagram showing the overlap of phyA-associated genes (ChIP-seq data) and phyA-regulated genes (RNA-seq data). Genes in the overlap (448 genes) are identified as phyA direct target genes. The P value of the Venn diagram was calculated using the hypergeometric distribution.
(C) GO analysis of phyA direct target genes. Each circle represents an enriched category compared with the whole genome after false discovery rate correction. The size of each circle is proportional to the number of genes annotated to the node. The color of each circle indicates the P value from 5 × 10⁻² to 5 × 10⁻⁷.

