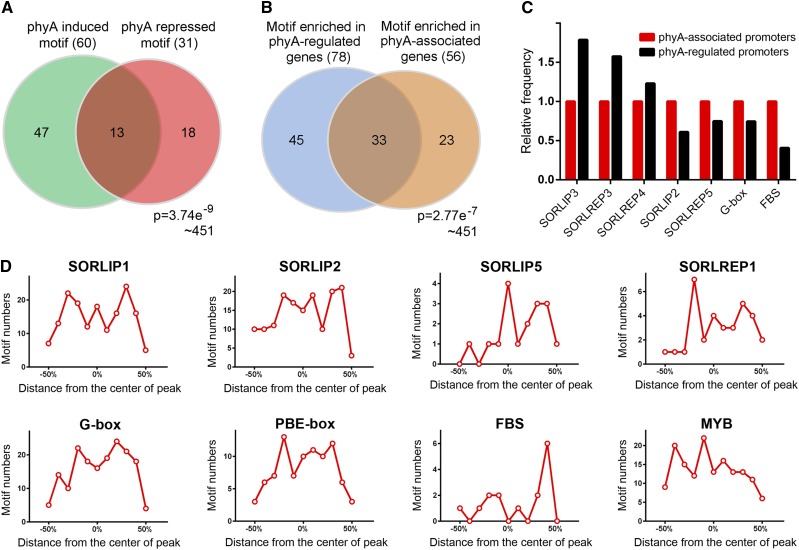
Figure 4.
Motif Analysis of phyA-Regulated and phyA-Associated Promoters.
(A) Venn diagram showing the overlap of motifs enriched in phyA-induced and -repressed genes. The frequency of each motif in the PLACE database was calculated. It is identified as an enriched motif if its frequency on phyA-regulated promoters is 1.5-fold or higher compared with that on a random genome. The P value was calculated using the hypergeometric distribution.
(B) Venn diagram showing the overlap of motifs enriched in phyA-regulated and -associated promoters. The P value was calculated using the hypergeometric distribution.
(C) Frequency of several phyA-responsive motifs in phyA-associated and -regulated promoters.
(D) Distribution of well-characterized highly redundant phyA-responsive motifs within phyA association regions (ChIP-seq peaks).

