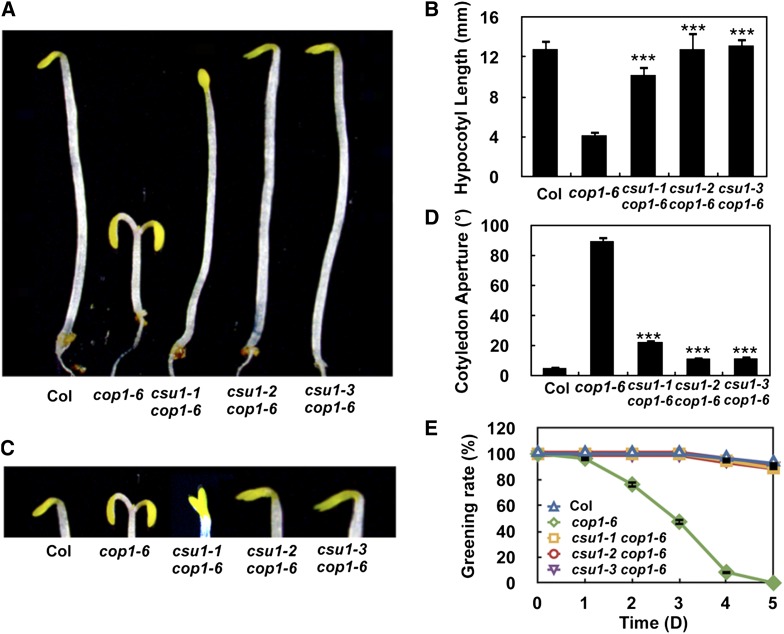
Figure 1.
csu1 Suppresses cop1 in Darkness.
(A) and (B) Hypocotyl lengths of 5-d-old wild-type, cop1-6, and csu1 cop1-6 seedlings grown in the dark. Error bars represent se (n ≥ 20). ***P < 0.001 (Student’s t test) for the differences between csu1 cop1-6 and cop1-6.
(C) and (D) Cotyledon phenotypes and separation angle of 5-d-old wild-type, cop1-6, and csu1 cop1-6 seedlings grown in the dark. Data represent means and se of at least 30 seedlings. ***P ≤ 0.001 (Student’s t test) relative to cop1-6.
(E) Quantification of photobleaching. Seedlings grown in the dark for various time periods were transferred to white light for 3 d, and the number of green seedlings was counted. The degree of photobleaching was expressed as the percentage of green seedlings. A total of 100 seedlings were used for each time point.

