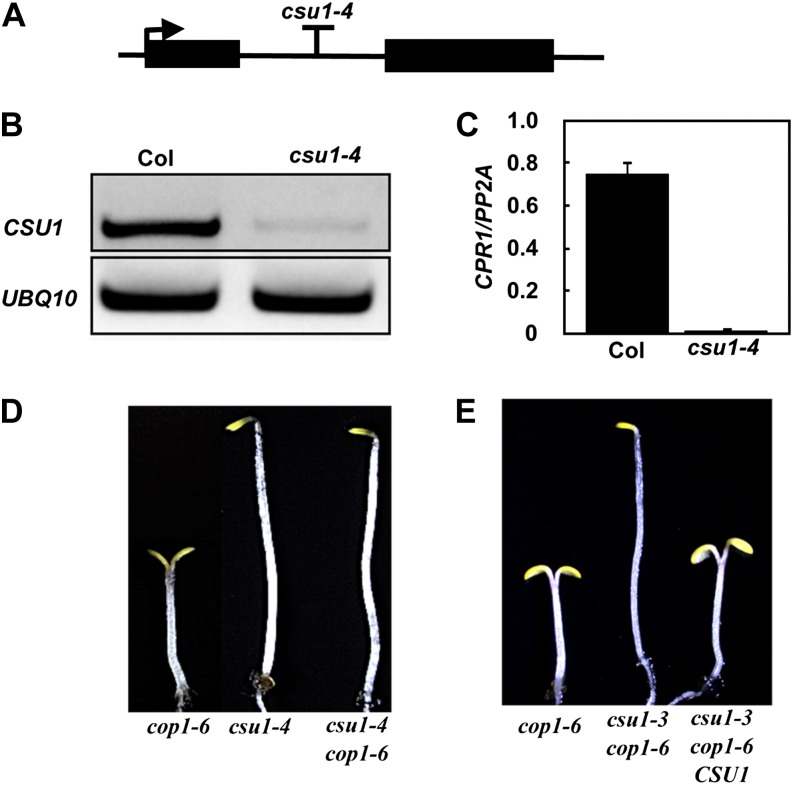
Figure 3.
Genomic Complementation Test.
(A) Schematic representation of the CSU1 gene (At1g61620). The arrow indicates the position of the start Met, and the T indicates the T-DNA insertion position.
(B) and (C) RT-PCR and quantitative real-time RT-PCR showing CSU1 transcript accumulation in wild-type and csu1-4 seedlings 5 d after germination under long-day conditions.
(D) csu1-4 suppresses cop1-6 in the dark. Seedlings were grown on GM medium plates for 5 d in darkness.
(E) Genomic complementation test. Representative cop1-6, csu1-3 cop1-6, and csu1-3 cop1-6 CSU1 seedlings grown on GM medium plates for 5 d under dark conditions are shown.
[See online article for color version of this figure.]

