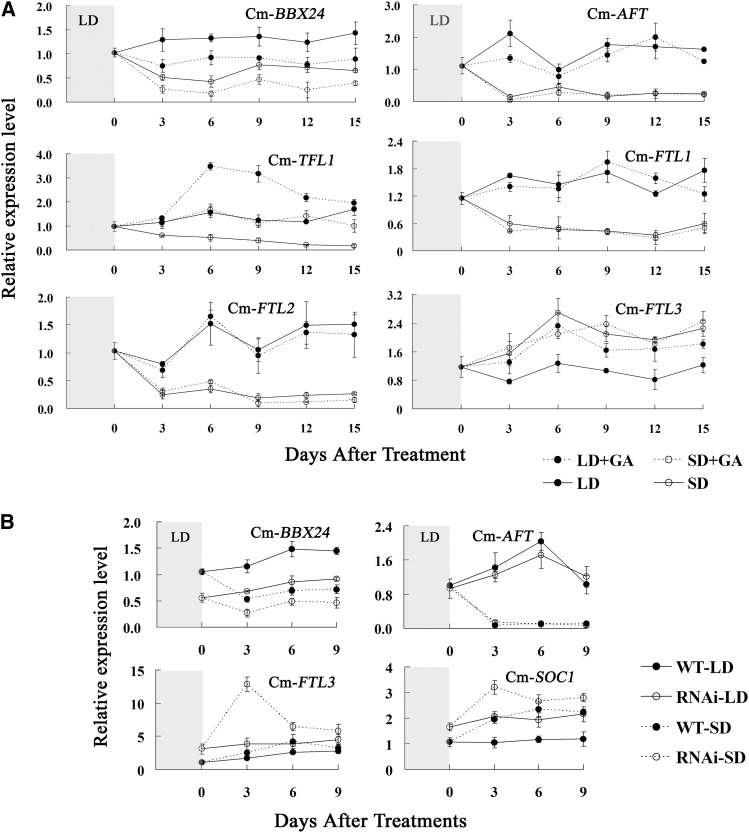
Figure 5.
Expression Profiles of Cm-BBX24 and Flowering-Time Integrators under Different Daylengths or following GA4/7 Applications for Chrysanthemum Plants.
(A) Expression profiles of Cm-BBX24 and Cm-FTs under different daylengths or following GA4/7 treatments. The gray area indicates LD, and 0 indicates the time at which the plants were transferred to SD. The data were normalized with Ubiquitin expression. Error bars indicate sd (n = 3).
(B) Expression profiles of Cm-BBX24 and flowering-time integrators under different daylengths in Cm-BBX24-RNAi plants. RNAi, Cm-BBX24-RNAi.

