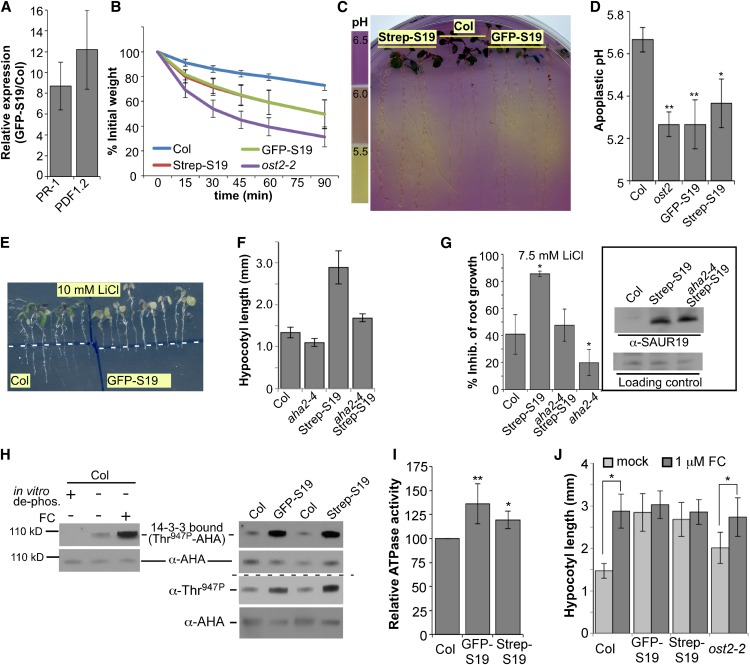
Figure 1.
SAUR19 Activates PM H+-ATPases.
(A) Quantitative RT-PCR analysis of PR-1 and PDF1.2 expression in 7-d-old Col and GFP-SAUR19 (GFP-S19) seedlings. Error bars depict sd obtained from three biological replicates.
(B) Kinetics of water loss in leaf detachment assays. Data points depict mean weights of 10 leaves/genotype ± sd. All genotypes exhibit significant differences from Col at all time points (P ≤ 0.05).
(C) Twelve-day-old seedlings were transferred to plates containing the pH indicator dye bromocreol purple. Color changes were recorded after 8 h.
(D) Leaf apoplastic pH; mean (n = 3) ± sd. Asterisks indicate significant difference from Col control by one-way ANOVA (**P < 0.01; *P < 0.05).
(E) Col and GFP-SAUR19 seedlings were transferred to media containing 10 mM LiCl and grown for 4 d. White lines indicate root tip position at the time of transfer.
(F) and (G) aha2-4 partially suppresses the long hypocotyl (F) and LiCl hypersensitivity (G) phenotypes of StrepII-SAUR19 seedlings. Values represent sample means ± sd (n ≥ 15). Inset: α-SAUR19 immunoblot confirming equivalent levels of StrepII-SAUR19 protein. For (F), all means are significantly different (P < 0.01) from one another by one-way ANOVA. For (G), asterisk indicates significant difference (P < 0.01) from Col control.
(H) Right: Increased C-terminal phosphorylation of PM H+-ATPases in GFP-SAUR19 and StrepII-SAUR19 seedlings. Levels of Thr-947-phosphorylated AHA proteins as monitored by GST-14-3-3 binding or α-Thr947P immunoblotting. Separate blots were used for the two experiments. Left: Plasma membranes prepared from untreated or FC treated (30 min) seedlings. Sample in the first lane was subjected to in vitro dephosphorylation (Hayashi et al., 2010).
(I) Relative vanadate-sensitive ATP hydrolytic activity in plasma membrane fractions prepared from 6-d-old etiolated seedlings. Values represent the means ± sd obtained from three biological replicates. Asterisks indicates significant difference from Col as determined by one-way ANOVA (**P < 0.01; *P < 0.05).
(J) FC promotes hypocotyl elongation of Col but not SAUR19 overexpressing seedlings. Three-day-old seedlings were transferred to media containing 1 μM FC and grown an additional 3 d. Asterisks indicate significant effect of FC as determined by one-way ANOVA (P < 0.01).

