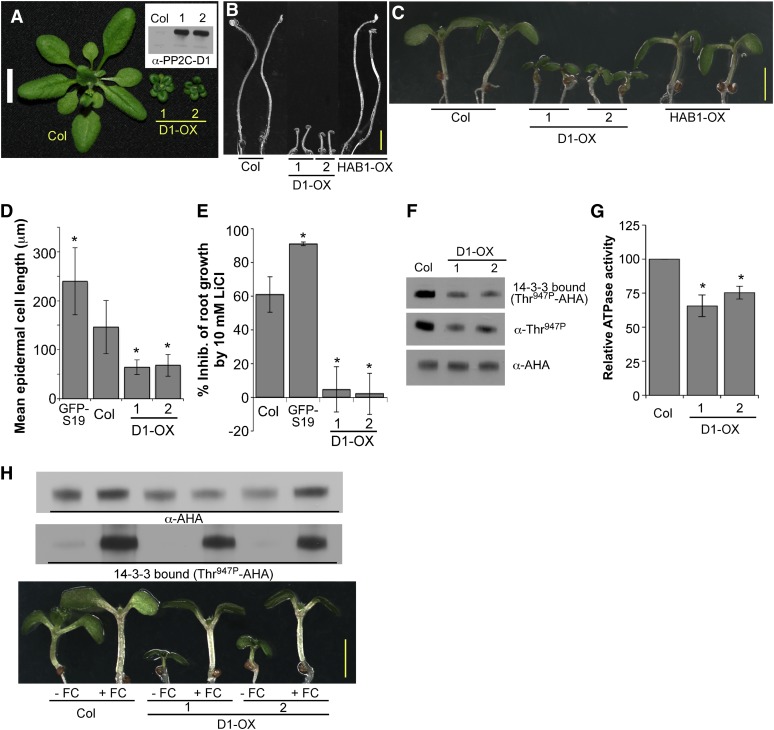
Figure 6.
PP2C-D1 Negatively Regulates Cell Expansion.
(A) Twenty-five-day-old Col and PP2C-D1 overexpression (D1-OX) plants. Two independent D1-OX lines are shown. Inset: α-PP2C-D immunoblot of the D1-OX lines depicted in (A). Bar = 1 cm.
(B) and (C) PP2C-D1 overexpression confers reduced hypocotyl length in both etiolated (B) and light-grown (C) 7-d-old seedlings. Bars = 2 mm.
(D) Mean epidermal cell length from 7-d-old light-grown seedling hypocotyls. The apical most 10 cells from 10 seedlings were measured. Error bars indicate sd.
(E) Inhibition of root elongation by 10 mM LiCl. Five-day-old seedlings were transferred to plates containing 10 mM LiCl and grown an additional 3 d. Values indicate sample means ± sd (n ≥ 20).
(F) Examination of AHA C-terminal phosphorylation in 6-d-old etiolated seedlings by both GST-14-3-3 far-western gel blot and α-Thr947P immunoblotting.
(G) Relative vanadate-sensitive ATP hydrolytic activity in plasma membrane fractions prepared from 6-d-old etiolated seedlings. Values represent the means ± sd obtained from three biological replicates.
(H) FC rescues the short hypocotyl phenotype of 35S:PP2C-D1 plants. Bottom: Seedlings were grown for 4 d on ATS media and then transferred to media containing 1 μM FC for 3 d. Top: GST-14-3-3 far protein gel blot analysis of AHA C-terminal phosphorylation in Col and PP2C-D1 overexpression lines ± FC.
For (D), (E), and (G), asterisks indicate significant difference from Col as determined by one-way ANOVA; P < 0.01.
[See online article for color version of this figure.]

