Figure 3.
Expression of MGT6 Is Induced by Low-Mg2+ Conditions.
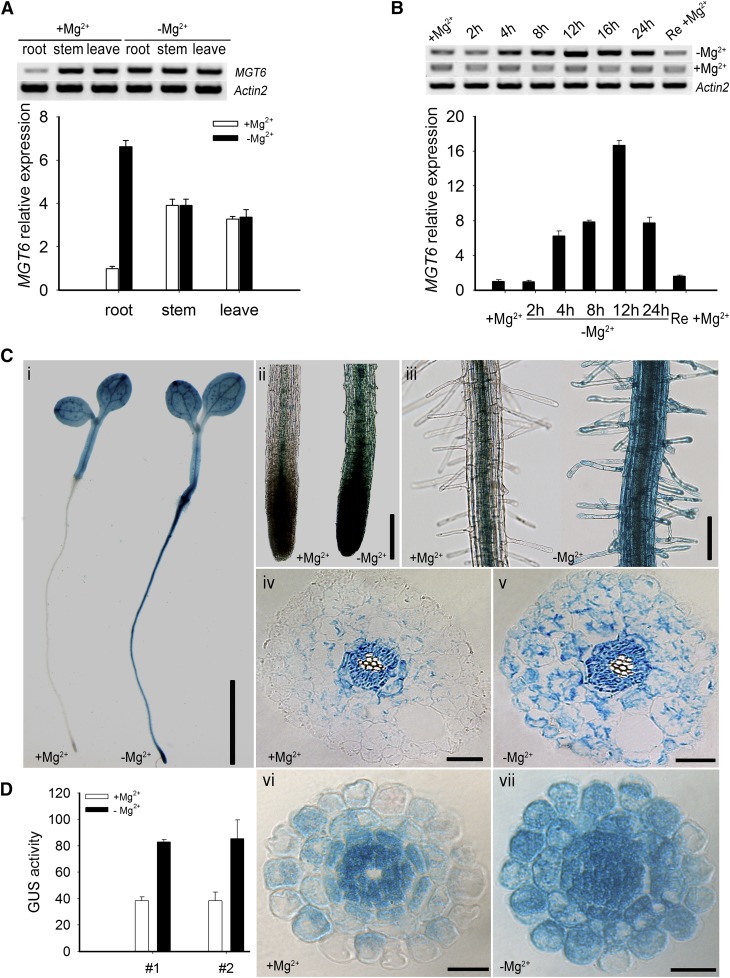
(A) RT-PCR products (top panel) and qRT-PCR analyses (bottom panel) showing MGT6 mRNA accumulation in roots, stems, and leaves. Wild-type plants (Columbia-0) were grown on MS solid medium containing 3 mM Mg2+ for 1 week and transferred to MS solid medium containing either 0 mM Mg2+ (−Mg2+) or 3 mM Mg2+ (+Mg2+) for 12 h. Significant differences between 0 and 3 mM samples are indicated in root tissue (P < 0.005 by Student’s t test). No significant difference was found in stem and leaf tissues (P > 0.05 by Student’s t test). Data are means of three replicates of one experiment. The experiment was repeated three times with similar results. Error bars represent sd.
(B) Time course of MGT6 mRNA accumulation in roots as shown by gel analysis of PCR products (top panel) and real-time PCR analyses (bottom panel). RNA samples were isolated from roots of plants grown in MS medium for 1 week and transferred to 0 mM Mg2+ (−Mg2+) or 3 mM Mg2+ (+Mg2+) for the indicated times. The right column represents the transcription level of the 12-h Mg2+-deprived plants resupplied with 3 mM Mg2+ (Re +Mg2+). Data are means of three replicates from one experiment. Similar results were obtained in three other experiments. Error bars represent sd.
(C) Histochemical analysis of MGT6 promoter–driven GUS reporter expression in transgenic Arabidopsis plants. The transgenic plants were grown as described in (A), and GUS activities (indicated in blue) were examined using histochemical staining. (i) GUS staining of 1-week-old plants (line 1) grown in minimal medium with 3 mM (+Mg2+) or 0 mM (−Mg2+) MgCl2. (ii) Enlarged images of the root tips in (i). (iii) Enlarged images of the root hair zones in (i). (iv) and (v) Cross section images of the elongation zone in (i). (vi) and (vii) Cross section images of the elongation zone in GUS-stained 1-week-old plants (line 2). Bar in (i) = 4 mm, bar in (ii) = 10 mm, bar in (iii) = 5 mm, and bars in (iv) to (vii) = 50 μm.
(D) Quantification of GUS activity in the cortex region of transgenic Arabidopsis plants containing the MGT6 promoter-GUS construct. Image J software was used to quantify the GUS signals in the root cortex areas of two transgenic lines (lines 1 and 2) treated with Mg2+-sufficient or Mg2+-deficient conditions. Three plants from each line were used for the analysis in one experiment. The experiment was repeated three times with similar results. Error bars represent sd.

