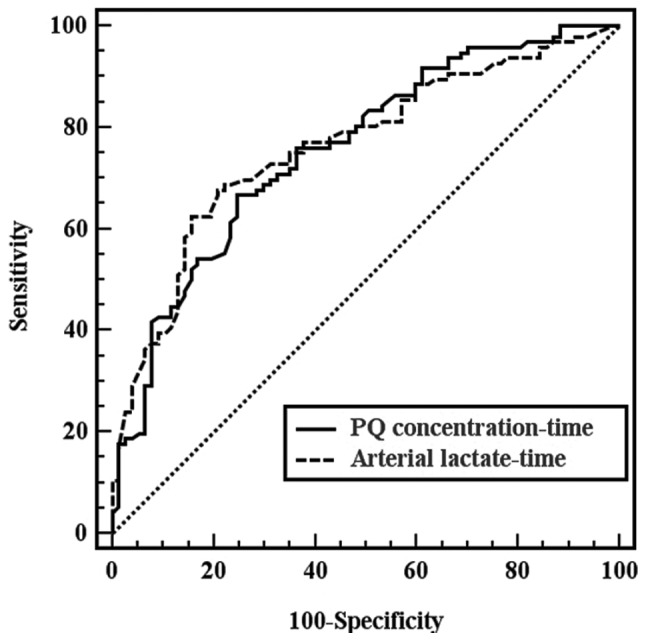
Figure 2.

ROC curves for arterial lactate concentration-time and PQ concentration-time. Pairwise comparison of the ROC curves revealed that there was no significant difference between the areas under the curve for arterial lactate concentration-time and PQ concentration-time (z=0.712; P=0.864). ROC, receiver operating characteristic; PQ, paraquat.
