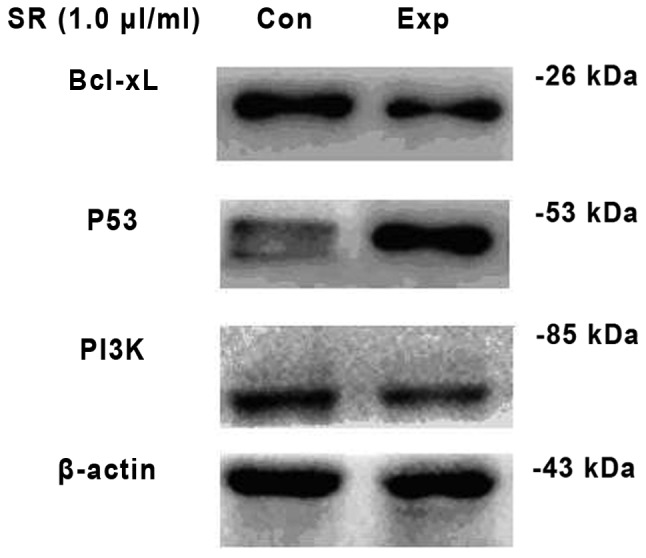
Figure 2.

Protein expression levels of Bcl-xL, p53 and PI3K in glioma U251 cells were measured by western blot analysis. β-actin was used as an internal control. The left of the figure indicates the control group, while the right indicates the experimental group. SR (1.0 μl/ml) indicates that the experimental group was treated with saw palmetto extract at a concentration of 1.0 μl/ml. PI3K, phosphatidylinositol 3-kinase; Bcl-xL, B-cell lymphoma-extra large.
