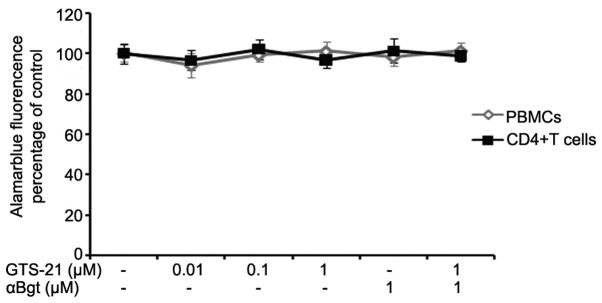
Figure 1.

Cell proliferation/viability analysis. Each point is the mean ± standard deviation of three independent determinations. Comparison between PBMCs and CD4+ T cells, P>0.05. αBgt, α-bungarotoxin, PBMCs, peripheral blood mononuclear cells; CD4, cluster of differentiation 4.
